The database can be analyzed in two ways:
“Search expression levels in one or several genes”
Searches the database for the expression of genes.
“Search all genes expression levels in one or more cell types”
Searches the database for the expression of arrays.
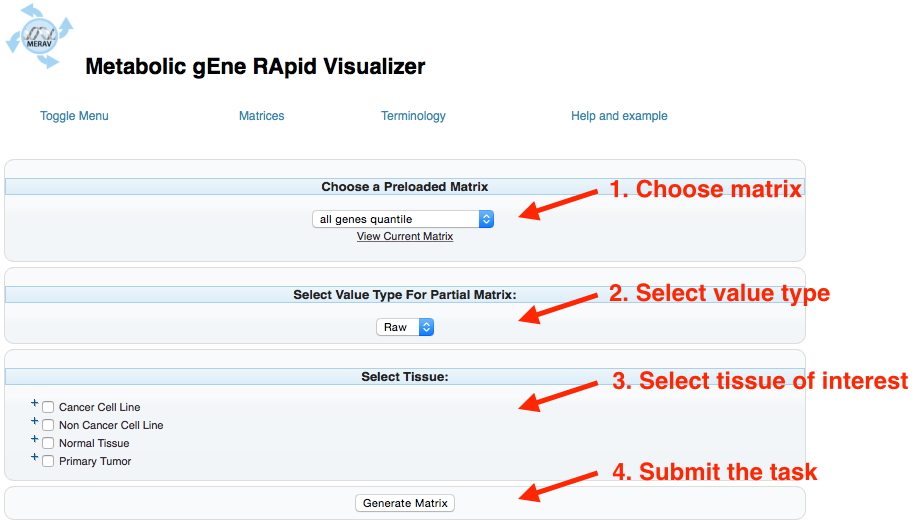
“Search expression levels in one or several genes” opens the Search window:
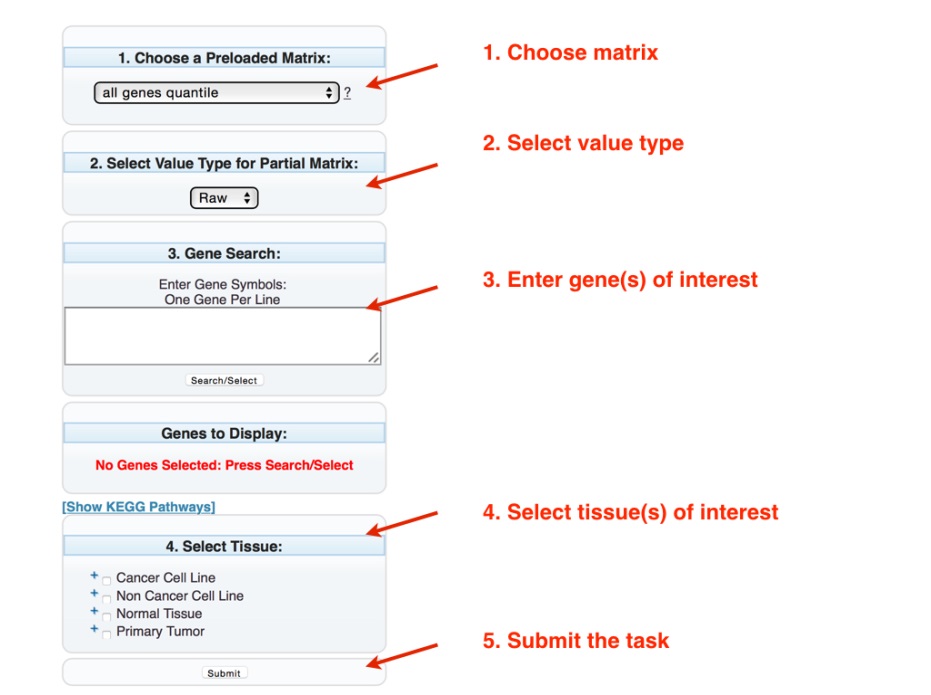
Choose a Preloaded Matrix: Chooses which matrix to analyze (see Matrices)
Select Value Type For Partial Matrix: Selects whether the output values are presented as raw (default) or the Log2 value.
Gene Search: Searches the matrix for the presence of the gene of interest, one gene per lane. A popup window will appear with the suggested genes. Upon selection, the name of the selected genes will appear in the Genes To Display section (see note). Alternatively, genes from the same metabolic pathways can be chosen from the KEGG website (http://www.genome.jp/kegg/) by selecting the “Show KEGG Pathway” link.
Note: Only the genes present in the “Genes To Display” box will be subjected to further analysis.
Note: If the gene is absent from the matrix a “Can not find gene in this matrix” message will be displayed.
Note: The “Search Results” popup window also provides links with more data about the gene of interest: the Entrez Page (http://www.ncbi.nlm.nih.gov/gene) and the KEGG database website (http://www.genome.jp/kegg/).
Select Tissue: Selects the tissues to be analyzed. Marking the boxes next to the tissue type (Cancer Cell Lines, Non Cancer Cell Lines, Normal Tissue, or Primary Tumor) will select all tissues in that category. Selecting the “+” next to the check box opens the next layer, where a specific tissue can be chosen.
Submit: Executes the desired task.
Note: it may take a few seconds to generate the graphs, especially when searching the “all genes” matrix.
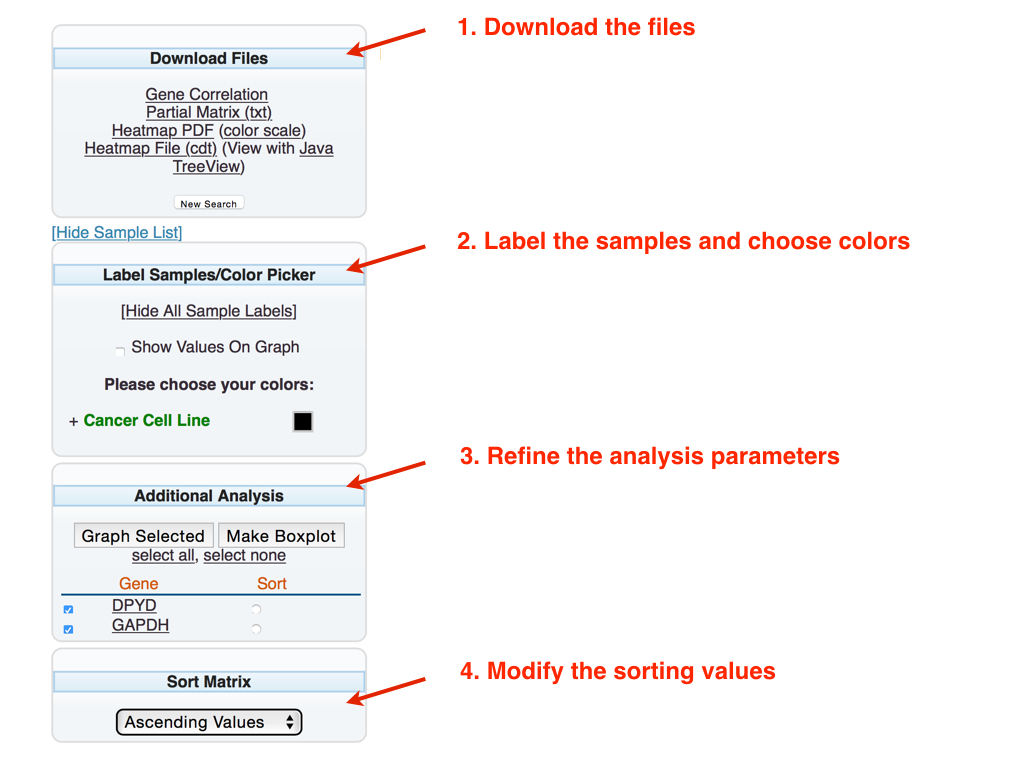
Download the files: The generated matrix can be downloaded in two formats:
Gene Correlation: Calculates the gene expression correlation (Pearson correlation) in all selected tissues. The gene correlation is displayed in a new window.
Partial Matrix (txt): Opens a new window which can be copied and pasted into a spreadsheet (e.g. Excel)
Heatmap PDF (color scale): Downloads a heatmap as a PDF file
Heatmap File (cdt): Downloads a heatmap (cdt file), which can be viewed with Java TreeView. Java TreeView can freely download via the link (View with Java TreeView)
New Search: Enter a new search.
Label the samples and choose colors: The bar graph can be modified in the following ways:
The gene expression values can be displayed directly on the bar graph.
Specific tissues in the bar graph can be color-coded. Choose the “+” next to the tissue type to display the tissue in the search. Select the box next to the tissue of interest and choose the desired color from the resulting popup color box. The number in parenthesis reflects the number of samples for the corresponding tissue.
Refine the analysis parameters: Submitting the task generates the default bar graph (of the first three genes, in alphabetical order). To modify the default options, select the desired modification options:
Graph Selected: To modify which genes are graphed, check the box to the left of the gene(s) of interest.
Make Boxplot: Generates a boxplot reflecting the expression of the desired gene in each selected tissue. This operation opens a new window.
The default reference gene for sorting is based on the first gene in the list (ordered alphabetically). Selecting the circle to the right of the gene name can set which reference gene used for the sort.
Modify the sorting values: Chooses the method to sort the bar graphs.
The following example demonstrates how to determine the expression of two metabolic genes: DPYD, and GAPDH.
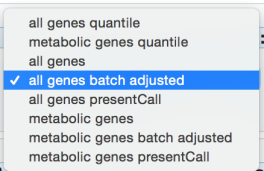
Choose the “metabolic genes batch adjust” matrix (as both genes are metabolic).
In the “Selected Value Type For Partial Matrix” select “Raw” (default).
![]()
Enter the genes of interest in the “Gene Search” box.
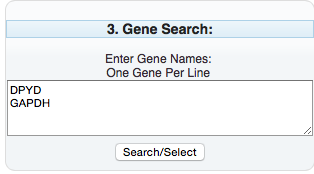
Selecting “Search/Selected” results in a Popup window:
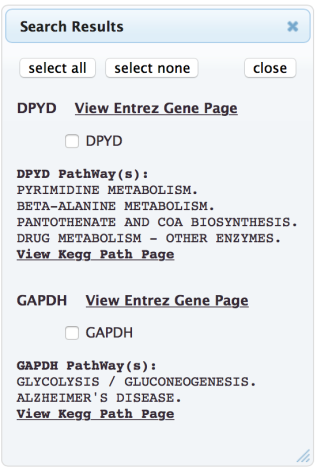
Select the genes to analyze by checking the associated box (alternatively by selecting “select all”).
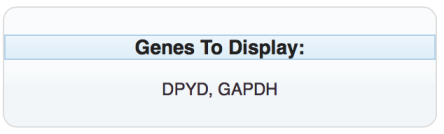
The selected genes will then appear in the “Genes to Display”
section of the Search window.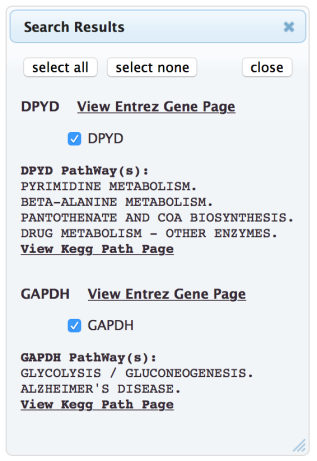
Select the desired tissue types (Cancer Cell Line, Non Cancer Cell Line, Normal Tissues, and Primary Tumor) and the tissues of interest. To limits the search to specific tissues within the selected tissue type, choose the “+” next to the tissue type. An additional layer will open. Check the specific tissues by checking the associated boxes. For this example, two sets of tissues were selected within the Cancer Cell Line tissue type: Breast and Lung.
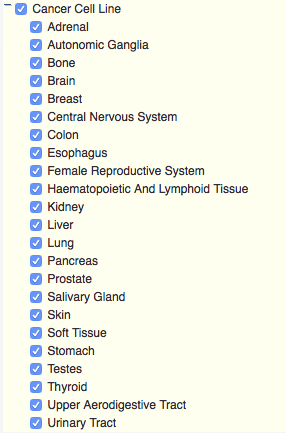
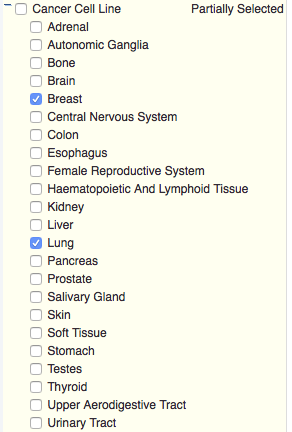
all Cancer Cell Lines selected Cancer Cell Lines (breast and lung)
In this example, analysis continues with only lung and breast cancer cell lines. (As shown on the figure, above right.)
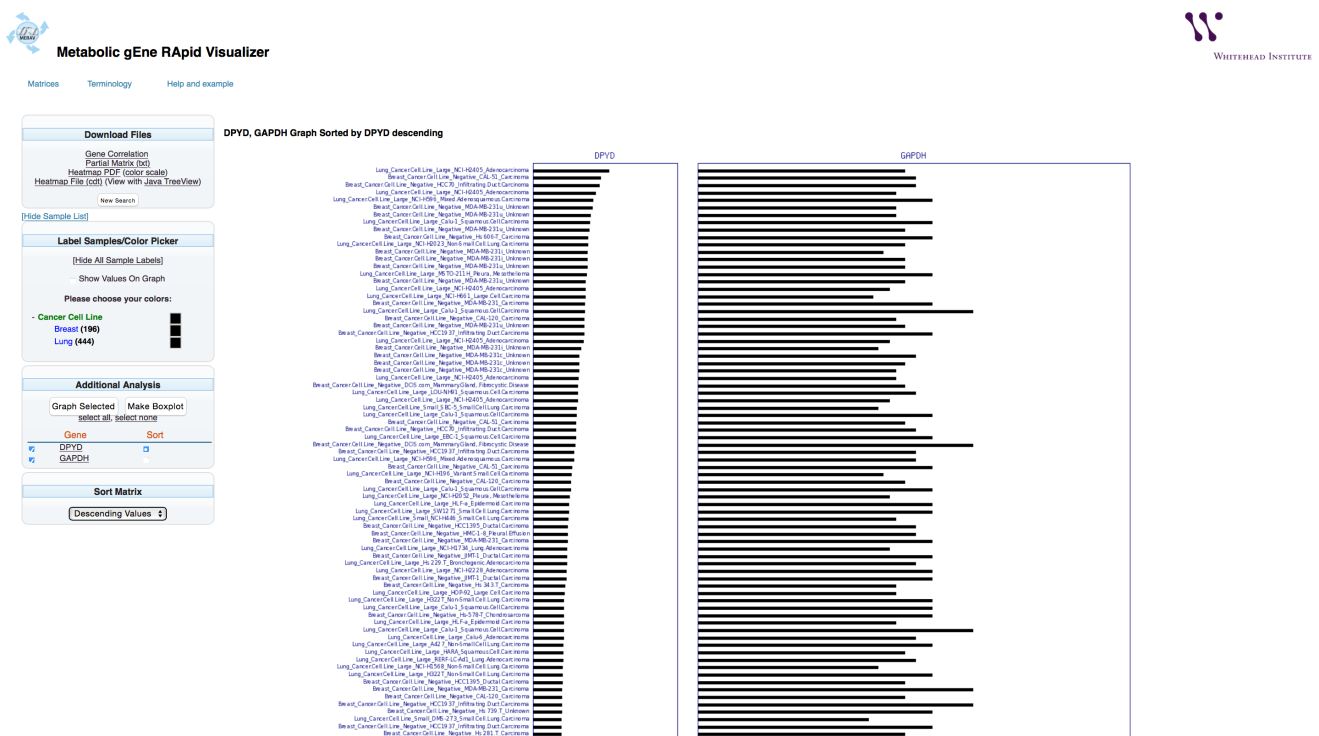
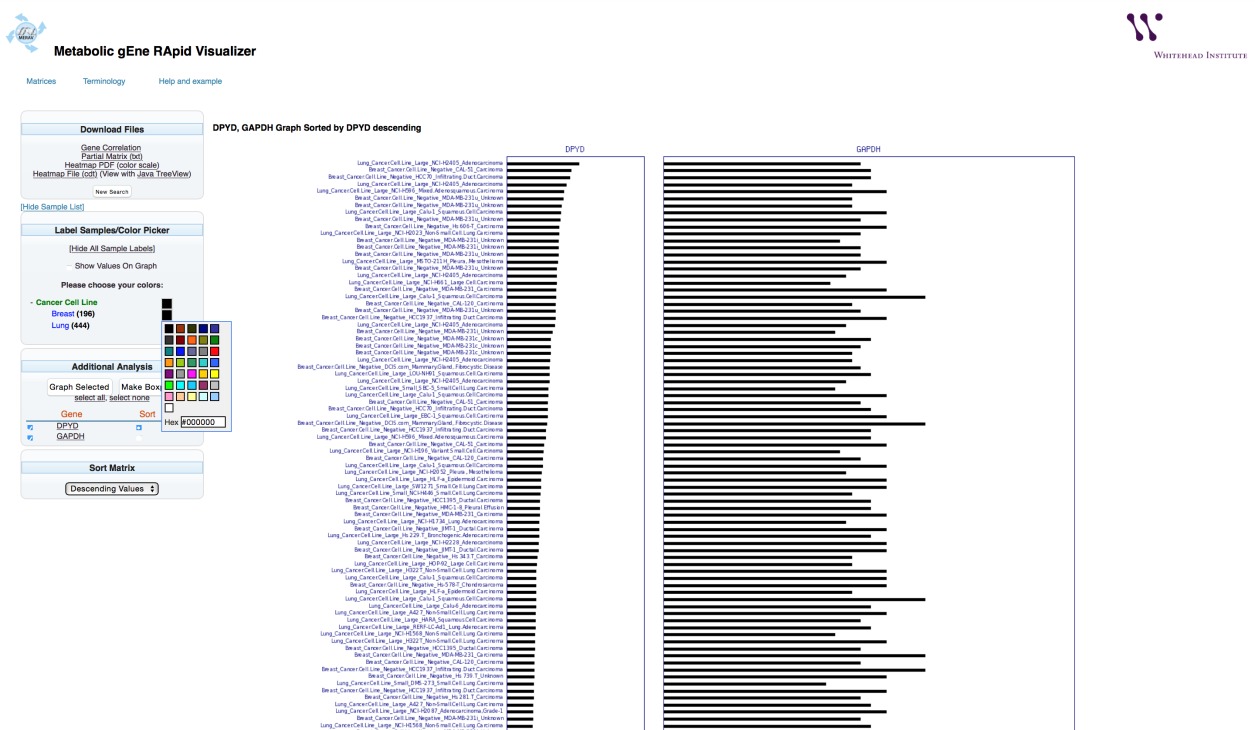
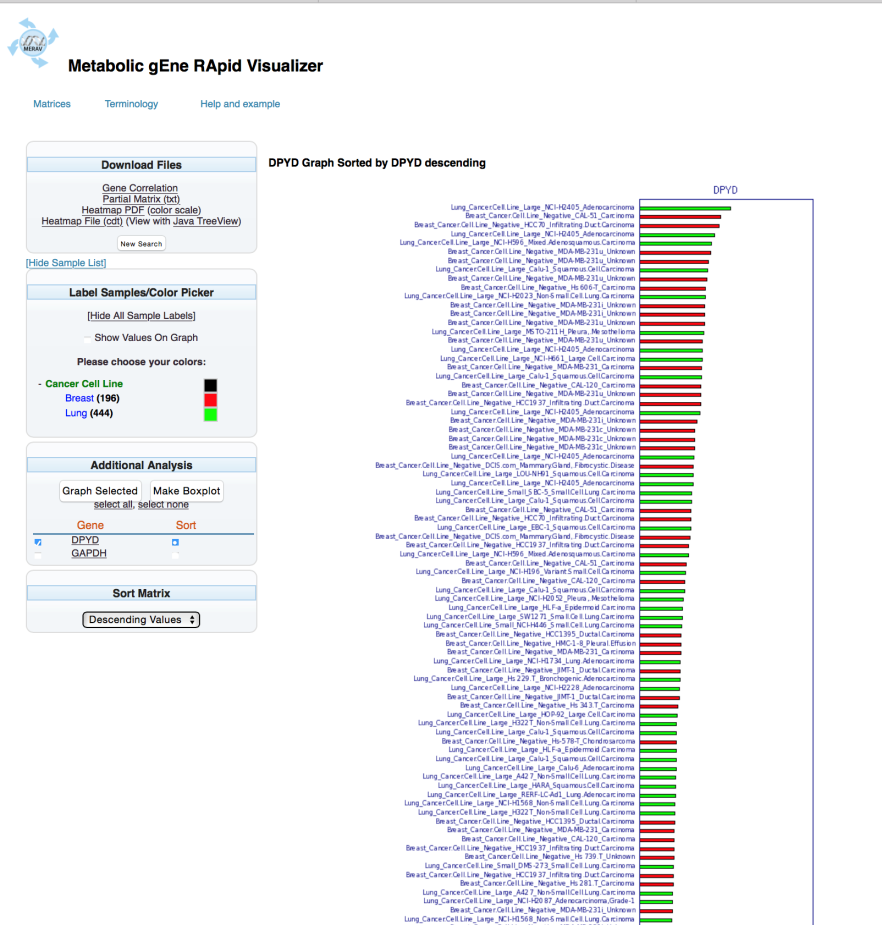
A graph that includes the selected tissues will appear.
The bar graph representing the gene expression level will automatically be displayed.
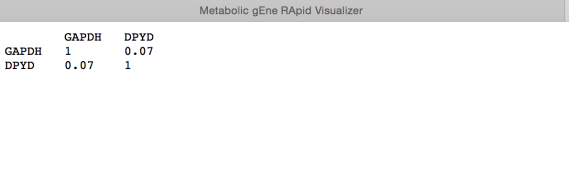
To calculate the Pearson correlation between expression of the selected genes, select “Gene Correlation” option. This will open a new browser tab.
In this example (breast and lung cancer cell lines), the Pearson correlation between DPYD and GAPDH gene expression is 0.07.
Note: If the “Gene Correlation” button doesn’t react, verify that the browser popup blocker is disabled
The raw data can be downloaded via the “Partial Matrix (txt)” link. This will open a new window.
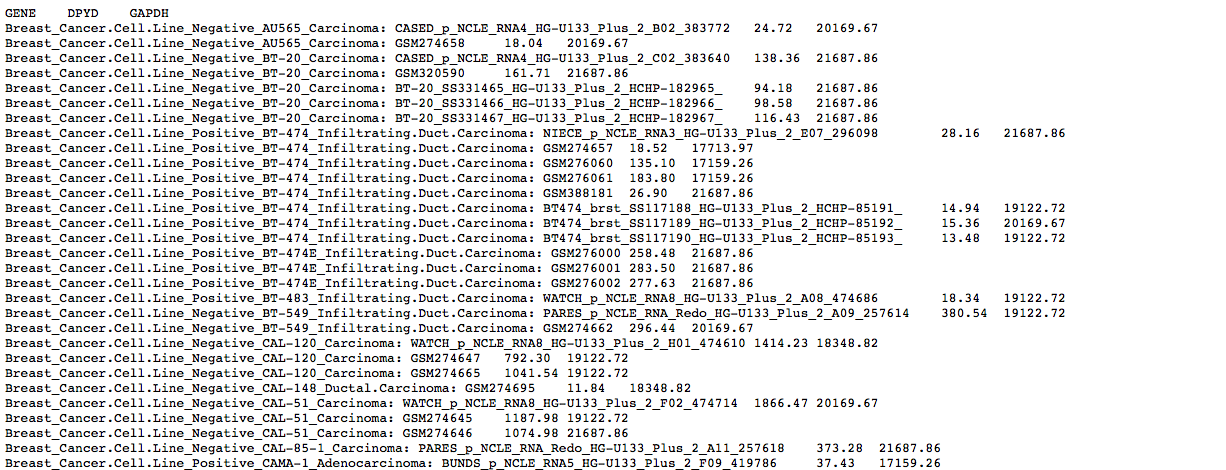
The content of the new window can be copied and pasted to a spreadsheet (e.g. Excel).
The generated matrix can also be converted to a heatmap. Selecting “Heatmap PDF” downloads the heatmap file as a PDF. Selecting “color scale” downloads the corresponding color scale in a separate PDF file.
Selecting the “Heatmap file (cdt)” link will download a heatmap file of the generated matrix. (Opening and viewing the cdt file requires Java TreeView software, available at http://jtreeview.sourceforge.net). Selecting “Java TreeView” refers the user to the appropriate website.
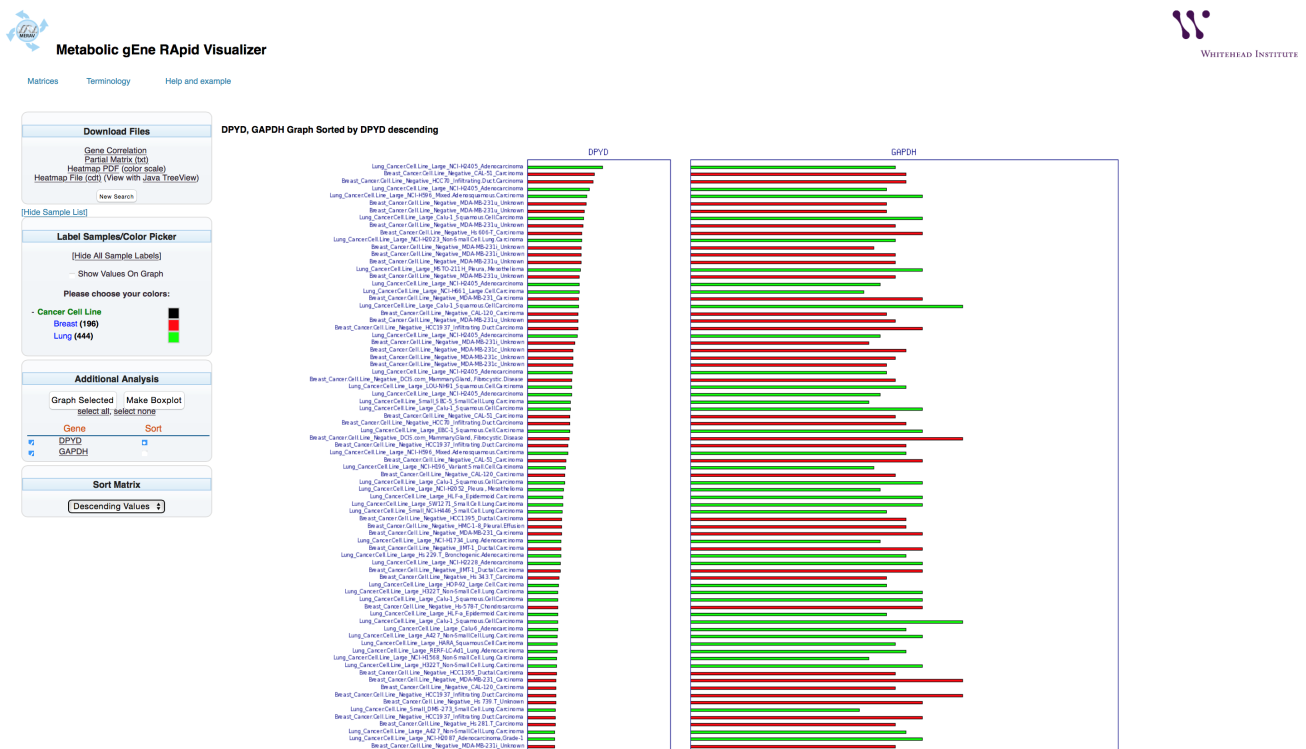
The bar graph colors can be changed to aid visualization.
To change he colors of the lung and the breast cell line to red and green, respectively, select the “+” next to the tissue type to display the tissues in the search. Select the box next to “Breast” and choose red. Select the box next to “Lung” and choose green.
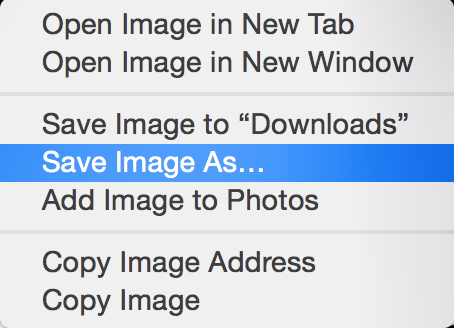
Save the image by right clicking on the image, selecting “Save Image As…” from the popup window, and selecting a destination for the image file.
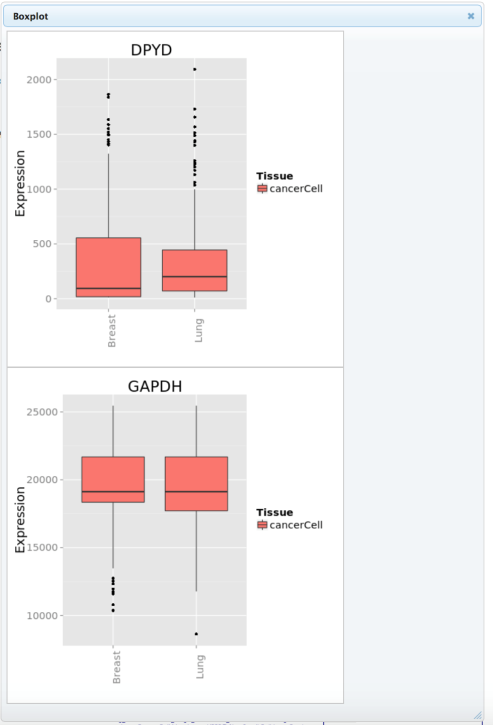
To modify which genes will be graphed, check the box next to the desired gene name. In this example, DPYD was chosen. Select “Graph Selected” to generate the revised bar graph.
In addition to a bar graph, the expression distribution of the selected genes can be presented as a boxplot graph where each of the tissues has its own boxplot. Select “Make Boxplot” to generate a boxplot.
The database may be searched for the expression of a given array.
Choose a Preloaded Matrix: Chooses which matrix to analyze (see Matrices)
Select Value Type For Partial Matrix: Selects whether the output values are presented as raw (default) or the Log2 value.
Select Tissue: Selects the tissues to be analyzed. Marking the boxes next to the tissue type (Cancer Cell Lines, Non Cancer Cell Lines, Normal Tissue, or Primary Tumor) will select all tissues in that category. Selecting the “+” next to the check box opens the next layer, where a specific tissue can be chosen.
Submit: Executes the desired task.
The resulting txt file can then be copied and pasted into an excel spreadsheet.
Q. Is there any limitation on the number of genes that can be analyzed?
A. No, there is no limitation.
Q. Can the matrix be downloaded?
A. Yes, by selecting “Partial Matrix (txt)” from the Gene Result window
Q. Is the expression between tissue types (e.g. between “Normal Tissues” and “Cancer Cell Lines”) comparable?
A. Yes, all of the data were normalized together. One can compare the expression across all samples.
Q. Gene Correlation button not reacting?
A. Verify that the browser popup blocker is disabled.
Q. My gene of interest is missing from the database.
A. Quality control analysis for all the genes was conducted. Some genes were found to have non-specific probes. Genes that did not meet the specificity threshold were not included in the MERAV database. For more information, please see the reference below.
Q. What are the references for citing MERAV?
A. Shaul, Y.D., Yuan, B., Thiru, P., Nutter-Upham, A., McCallum, S., Lanzkron, C., Bell, G.W., Sabatini, D.M. (2015) MERAV: a tool for comparing gene expression across human tissues and cell types. Nucleic Acids Res. 44 (560-566)